Monitor usage and operations
Use logs, publish history, smoke tests, and usage views to operate MCP servers after launch.
After a server is published, the operational question changes from "does it generate?" to "can developers trust it in production?" MCP Stack surfaces the signals you need to debug MCP traffic and keep the runtime healthy.
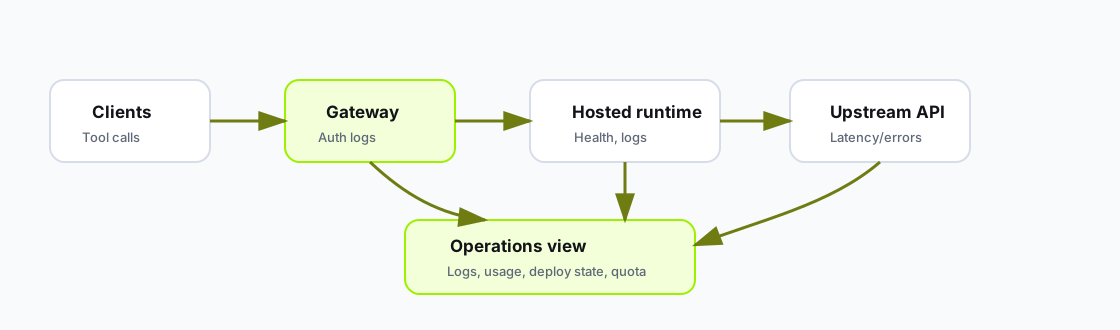
Operational views connect client traffic, Gateway decisions, runtime health, upstream calls, and quota pressure.
Use this order during an incident:
Hosting tab.tools/list smoke result from the dashboard or CLI.Hosting, confirm publish status, regional health, and the active MCP URL.Logs, filter request and tool-call history (paginated).Gateways → select the profile → Logs when auth is involved.Usage or Settings → Billing for org-level consumption and credit balance.For agent-specific spend, open the agent Budget & Usage tab. See Agent budgets and usage.
mcpstack servers get support-api --json
mcpstack smoke tools-list support-api --json
mcpstack servers checks support-api --json
mcpstack logs stream support-api
mcpstack gateways logs gw_support
mcpstack operations list support-api --json
mcpstack agents usage ag_support --json
Use servers checks and smoke tools-list as release gates after config changes.
Read server logs (paginated):
GET /api/v1/organizations/{orgId}/mcp-servers/{serverId}/logs?page=1&pageSize=50
Authorization: Bearer {token}
Run hosting checks and smoke tests:
POST /api/v1/organizations/{orgId}/mcp-servers/{serverId}/hosting-checks
POST /api/v1/organizations/{orgId}/mcp-servers/{serverId}/mcp-smoke/tools-list
Read deployment state and operations:
GET /api/v1/organizations/{orgId}/mcp-servers/{serverId}/deployment
GET /api/v1/organizations/{orgId}/mcp-servers/{serverId}/deployment-operations
Read Gateway logs:
GET /api/v1/organizations/{orgId}/gateways/{gatewayId}/logs?page=1&pageSize=50Read AI credit summary:
GET /api/v1/organizations/{orgId}/ai-credits/summaryGateway and server logs help answer:
Use logs to debug behavior before changing prompts. Many "agent bugs" are actually auth, schema, or upstream API errors.
Watch tool-call volume, response sizes, runtime errors, agent usage, hosted server count, and AI credit balance. Hosted runtimes have plan limits for max tool-call duration and request/response size.
See Billing and AI credits for purchases, ledger history, and hosted plan caps.
{
  "server": "support-api",
  "transport": "streamable-http",
  "status": "passed",
  "toolCount": 14
}
Run smoke checks after server creation, saved server changes, Gateway changes, and upstream auth changes.
| Symptom | What to check |
|---|---|
| Empty server logs | Confirm requests hit the correct MCP URL; check Gateway vs direct hosted URL. |
| Smoke passes but agent fails | Compare agent-attached server, Gateway grants, and tool instructions. |
| Sudden usage spike | Agent budget settings, embed traffic, external client volume. |
| Credits drop without code changes | Ledger debits for hosted agent usage; open Settings → Billing. |
When an agent can't use a tool, collect the server ID, timestamp, client or agent, tool name, and whether tools/list passes. Then compare Gateway logs, runtime logs, and upstream API responses for the same window.